Posts tagged #stroke

How to Talk Like a Neurologist

Written by: Saabir Kaskar, MD (NUEM ‘23) Edited by: Nick Wleklinski (NUEM ‘22)
Expert Commentary by: Fan Caprio, MD


Neurology Scores: LVO, NIHSS, and ICH

As first line providers, being able to effectively communicate with ancillary services and specialties is key to advancing patient care within the emergency department. When patients present with symptoms concerning for ischemic or hemorrhagic stroke, there are a variety of clinical decision tools available to help direct interventions and predict patient outcomes.  Having a basic understanding of these scoring systems helps ED providers communicate more effectively with our neurology colleagues. This post highlights indications, strengths, and limitations of common stroke assessment scales used in the prehospital and hospital setting.  

Cincinnati Prehospital Stroke Scale (CPSS)

The Cincinnati Prehospital Stroke Scale is a simple, easy to teach, three-part evaluation and is the most cited scale in statewide EMS protocols. Patients with one of these three findings, as a new event, will have 72% probability of ischemic stroke. If they have three of these deficits, that probability increases to 85%. Further, those scoring higher on this scale are more likely to have a large vessel occlusion (LVO) and warrant transfer to a comprehensive stroke center. One major limitation is that the CPSS does not identify features of posterior circulation strokes.

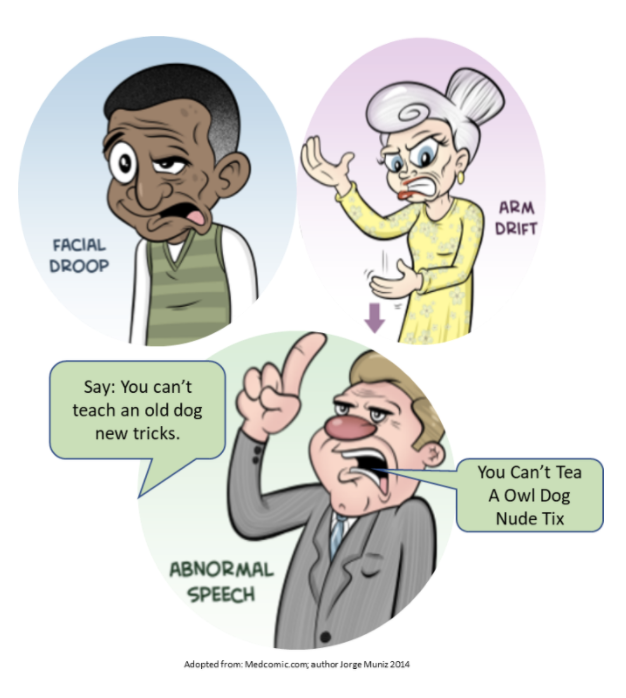
Figure 1: Cincinnati Prehospital Stroke Scale components

Predicting Large Vessel Occlusion 

There are many stroke severity scales that are useful in predicting large vessel occlusion (LVO) in the pre-hospital setting. Early LVO detection is useful as these patients have better outcomes if transported to comprehensive stroke centers (CSCs) which have endovascular interventions, such as thrombectomy, readily available. Such interventions are not available at primary stroke centers (PSC). LVO screening tools include the Rapid Arterial Occlusion Evaluation Scale (RACE), the Cincinnati Prehospital Stroke Severity Scale (CP-SSS/C-STAT), the Los Angeles Motor Scale (LAMS), and the Emergent Large Vessel Occlusion Scale (ELVO). While these scales are good, none have achieved an optimal sensitivity/specificity combination which is why there is no “gold standard” test per the most recent 2019 AHA guidelines (Powers et al. Guidelines for Early Mgmt of Patients with AIS. Stroke 2019). 

The Rapid Arterial Occlusion Evaluation Scale (RACE), for example, is one of these severity scales that predicts stroke caused by large vessel occlusion. It is based on the NIHSS but provides quicker assessment in the pre-hospital environment. It focuses on facial palsy, extremity motor function, head deviation, gaze deviation and aphasia or agnosia. The scale ranges from 0-9 with scores ≥ 5 being associated with detection of an LVO. RACE has a sensitivity of 85% and specificity of 68% for LVO at scores ≥ 5. 

Another example of a LVO screening tool is the Cincinnati Prehospital Stroke Severity Scale (CP-SSS/CSTAT) which is important to differentiate from the CPSS outlined above.  CSTAT focuses on gaze deviation, level of consciousness and arm weakness. Both RACE and CSTAT are validated in the prehospital setting and with external data sets. However, CSTAT is more convenient with fewer items to score. 

EMS protocol in Chicago (Region XI), utilizes a two-tier system that first involves the Cincinnati Stroke Scale and finger to nose test. If either aspect is abnormal, then stroke severity is assessed with the 3-Item Stroke Scale (3I-SS) which assesses level of consciousness, gaze preference and motor function, scored from 0-6. If the 3I-SS score is ≥4 and the last known normal is ≤6 hours ago then the patient is transported to the closest CSC instead of the closest primary stroke center (PSC), as long as the added transport time is not >15 minutes.  

National Institutes of Health Stroke Scale (NIHSS)

The NIHSS is a 11-part scoring tool and is the gold standard when assessing stroke patients in hospital (figure 3). Higher scores indicate a more severe stroke and usually correlate with infarct size on CT and MRI. Taken within the first 48 hours of acute stroke, the NIHSS helps predict three month and one-year clinical outcomes. For example, patients with a NIHSS of 1-4 have a high likelihood of functional independence and favorable outcome regardless of treatment. The NIHSS does not serve as the primary clinical guide in determining tPA administration. However, given that higher scores correlate with larger infarct size, caution is advised when considering tPA in patients with a NIHSS >22 as there is a higher risk of hemorrhagic conversion (see figure 2 for full tPA exclusion criteria). Analysis from subjects of the NINDS trials show that a NIHSS of >20 was associated with a 17% rate of intracranial hemorrhage with tPA when compared to 3% hemorrhage rate in patients with a score of <10.

Figure 2: Contraindications for tPA administration

Overall, the NIHSS is a reliable scoring tool to quicky assess the effects of stroke. Medical providers and nurses have been shown to have similar levels of accuracy when trained. Limitations include assessing posterior circulation stroke that involve gait abnormality, dizziness, or diplopia.

Figure 3: NIHSS, adopted from the American Stroke Association

Intracerebral Hemorrhage Score (ICH Score)

The ICH score is an important tool when evaluating a hemorrhagic stroke. This score was developed to standardize clinical grading of ICH and to improve communication between providers. This five-component scoring system (Figure 4) helps quantify ICH severity and subsequently 30-day mortality  (Figure 6) with a sensitivity of 66%. It is not used to determine treatment modality. This score helps universalize the grading of ICH severity, providing a standardized language that can be used between EM providers, neurologists, and neurosurgeons. Further, this score can help providers guide goals of care conversations with patient’s families and determine appropriate level of care or transfer.

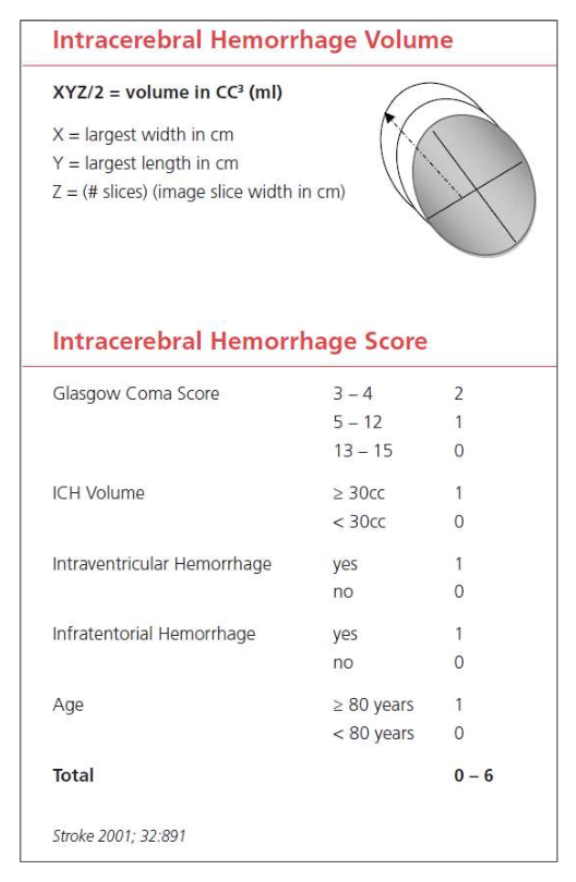
Figure 4: ICH score, adapted from the American Stroke Association

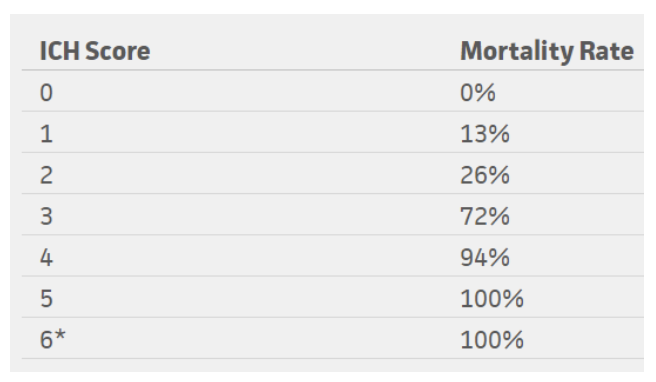
Figure 5: Mortality rates based on ICH score

*No patients in the study scored 6, but estimated 100% mortality

Conclusion

In summary, it is important to understand how to utilize these scoring tools for ischemic and hemorrhagic stroke. Knowing how to interpret pre-hospital stroke scores and how to calculate a NIHSS score accurately and quickly is helpful in not only quantifying severity but also in improving communication between providers. Improved understanding and effective use of these tools can help better advance care of our stroke patients efficiently. These tools can also remind us of the severity of the neurologic deficit we observe on clinical exam. Subsequently, this can be helpful in guiding discussions with patients and their families regarding the severity of their condition.

References

Adams HP Jr, Davis PH, Leira EC, et al. Baseline NIH Stroke Scale score strongly predicts outcome after stroke: A report of the Trial of Org 10172 in Acute Stroke Treatment (TOAST). Neurology 1999; 53:126.

Goldstein, L. (2019). Use and utility of stroke scales and grading systems. Up To Date

Goldstein L, Bertels C, Davis JN. Interrater reliability of the NIH stroke scale. Arch Neurol 1989; 46:660.

Generalized efficacy of t-PA for acute stroke. Subgroup analysis of the NINDS t-PA Stroke Trial. Stroke 1997; 28:2119.

Hemphill JC 3rd, Bonovich DC, Besmertis L, Manley GT, Johnston SC. The ICH score: a simple, reliable grading scale for intracerebral hemorrhage. Stroke. 2001 Apr;32(4):891-7. PubMed PMID: 11283388.

Kothari RU, Pancioli A, Liu T, et al. Cincinnati Prehospital Stroke Scale: reproducibility and validity. Ann Emerg Med 1999; 33:373.

Pérez de la Ossa N, Carrera D, Gorchs M, et al. Design and validation of a prehospital stroke scale to predict large arterial occlusion: the rapid arterial occlusion evaluation scale. Stroke 2014; 45:87.

Schlemm L, Ebinger M, Nolte CH, Endres M. Impact of Prehospital Triage Scales to Detect Large Vessel Occlusion on Resource Utilization and Time to Treatment. Stroke 2018; 49:439.


Expert Commentary

Thanks for writing this comprehensive summary of common screening tools used in stroke patients. Having a good handle on these tools will allow you to quickly and effectively communicate with comanaging care providers. It is also important to understand how and why each scale was developed, so they can be used in the appropriate setting to expedite care in extremely time-sensitive neurologic emergencies.

Keep in mind that scales are merely screening tools and are not meant to give a definitive diagnosis. No scale is perfect, but you have highlighted some that yield the highest sensitivity and specificity for identifying a potential stroke patient. In addition to leaning on these scales as decision support tools, always use your clinical judgement. A few things to remember in addition to the neurologic symptoms:

* Strokes are potentially intervenable within the first 24 hours:

1. Up to 4.5 hours – IV-TPA / tenecteplase.

2. Up to 6 hours – Thrombectomy with LVO on vessel imaging.

3. Up to 24 hours – Thrombectomy with LVO + favorable penumbra on perfusion imaging.

* Last known normal (LKN) starts the timer to when stroke patients are eligible for intervention (not to be confused with time of symptom discovery!)

* Strokes typically cause a sudden loss of function (in contrast to positive phenomena such as convulsive movements, tingling sensation, sparkling vision, which can point away from a stroke diagnosis)

* In patients with prior deficits, ask which symptoms are new or different in comparison to their baseline.

The NIHSS is widely accepted as THE stroke severity scale, and it has many strengths and some pitfalls. The NIHSS was initially developed to be used in research, and, as mentioned here, was designed to be reproducible between various groups – physicians, nurses, research staff. Higher scores correlate with bigger infarct volume. The NIHSS is not an accurate scale in that it does not necessarily capture each patient’s deficits, omitting brain functions such as gait, distal limb dexterity, and cognition. It also scores higher for dominant (L) hemispheric functions as many points depend on language function.

When screening for large vessel occlusion, remember key brain structures and functions from the L MCA, R MCA, and posterior circulation. Looking for cortical signs can be very helpful to identify larger stroke syndromes: aphasia, neglect, gaze deviation, visual field deficit.

Last but not least, keep in mind that hemorrhagic strokes (intracerebral hemorrhage, subarachnoid hemorrhage) account for about 15% of all strokes. The same screening tools for acute neurologic symptoms can be used to identify these patients, though they more often have concurrent headache or LOC than ischemic strokes (due to increased ICP and irritation from blood products). For SAH, two scales are commonly used to describe the clinical and radiographic severities: Hunt-Hess (surgical risk index) and modified Fisher scales (risk index for developing vasospasm).

Figure 1: Hunt-Hess Scale

Figure 2: Modified Fisher Scale

Fan Caprio, MD

Assistant Professor of Neurology (Stroke)

Department of Neurology

Northwestern Memorial Hospital


How To Cite This Post:

[Peer-Reviewed, Web Publication] Kaskar, S. Wleklinski, N. (2021, Oct 25). How to Talk Like a Neurologist. [NUEM Blog. Expert Commentary by Caprio, F]. Retrieved from http://www.nuemblog.com/blog/neuro-scores


Other Posts You May Enjoy

Emergency Guide to Stroke Neuroimaging

stroke neuroimaging_image.png

Written by: Justin Seltzer, MD (PGY-3) Edited by: Luke Neill, MD (PGY-4) Expert commentary by: Babak Jahromi, MD, PhD


According to the CDC, an ischemic stroke occurs approximately every 40 seconds in the US, with nearly 800,000 documented cases annually.[1] This, combined with an effective national stroke symptom public education program, has resulted in a large number of patients presenting to emergency departments for evaluation of stroke or stroke-like symptoms. Essential to this initial evaluation is neuroimaging, which in the emergency department is mainly CT based. 

However, despite frequent use, many emergency physicians are not familiar enough with stroke imaging to interpret images on their own. A prior post addressed the basics of reading a complete head CT, which you can find here. The goal of this article is to discuss the indications and limitations as well as to provide a basic guide to interpretation of noncontrast CT imaging of the brain (NCCT), CT angiography (CTA) of the head and neck, and CT perfusion (CTP) imaging in acute stroke evaluation.

Acute stroke imaging is obtained in the emergency department for two purposes. 

  1. To evaluate rapidly for thrombolysis contraindications like hemorrhage and certain pathology such as vascular malformations and aneurysms. Thrombolysis has a high therapeutic benefit in stroke patients, with a number needed to treat of 10 within 3 hours of symptom onset and less than 20 if administered within 4.5 hours.[2,3] In addition, door to needle time of less than one hour is an established benchmark and quality measure.[3]

  2. To identify a causative vascular lesion, which may or may not be amenable or contraindicatory to thrombolysis

Non-Contrast Head CT

NCCT is usually the first imaging modality obtained in the acute evaluation for stroke. Within the thrombolysis window (<4.5 hours), however, this scan is far more likely to detect hemorrhage than infarction. Chalela, et al., reviewed 356 patients evaluated for stroke symptoms at a single center over 18 months. They showed a sensitivity of 89% for detection of acute intracranial hemorrhage; conversely, the sensitivity for ischemic strokes less than 3 hours old was 12%, 16% for those older than 12 hours, and an overall sensitivity of 16%.[4] These findings are consistent with other studies and highlights the limitations of NCCT in acute stroke imaging. 

Despite the poor sensitivity for acute infarction, there are a few ways to improve detection. Windowing adjustments can enhance grey-white matter differentiation, as loss of this in an area anatomically associated with the presenting deficit is suggestive of acute infarction. A window width and center of approximately 50 each achieves adequate grey-white differentiation (Figure 1). Additionally, asymmetric, hyperdense section of cerebral vasculature, known as the “dense vessel” sign, is also highly suggestive of middle cerebral artery (MCA) occlusion.[5] As a side note, IV contrast should not be used outside of angiography to “enhance” the image as it may extravasate into the ischemic parenchyma mimicking hemorrhage.[6] 

Figure 1. NCCT of the brain in an acute right M1 occlusion with a last known well time was approximately 13 hours before. Windowing set at C50/W50 for improved grey-white differentiation. Official read: “A diffuse asymmetric hypodensity and subtle l…

Figure 1. NCCT of the brain in an acute right M1 occlusion with a last known well time was approximately 13 hours before. Windowing set at C50/W50 for improved grey-white differentiation. Official read: “A diffuse asymmetric hypodensity and subtle loss of gray-white matter differentiation in the right frontal and parietal region is highly concerning for an acute right MCA stroke.”

CT Angiography of the Head and Neck

The role of CTA in acute stroke evaluation is to identify the culprit vascular lesion and is an excellent addition to the emergent evaluation of acute ischemic stroke. A 2014 pooled analysis of 21 studies from 1993 to 2013 showed CTA has a sensitivity of 83.2% and specificity of 95% with a 97.1% negative predictive value for greater than 50% cerebral vascular stenosis;[7] a 2017 pooled analysis of 7 studies from 2003 to 2012 broadly reported a sensitivity of 93% and specificity of 100% for acute ischemic stroke.[8] CTA of the neck is also obtained to evaluate the contributing cervical vasculature. Since interpretation of angiography is dependent on knowledge of the relevant anatomy, the key structures are reviewed below. If a more detailed review is desired or necessary, several neuroanatomy texts may be found in the references. 

The major cerebral vasculature is supplied by the bilateral internal carotid arteries (ICA; “anterior circulation”) and the paired vertebral arteries (VA) that merge to form the basilar artery (BA; “posterior circulation”). The anterior circulation dominates perfusion of the cerebral hemispheres apart from the occipital lobe. The posterior circulation feeds the remaining structures, mainly the occipital lobe, cerebellum, and brain stem. 

Figure 2. CTA of the neck showing bilateral patent CCAs and VAs.

Figure 2. CTA of the neck showing bilateral patent CCAs and VAs.

Anterior circulation

The anterior circulation starts with the ICA, which branches from the common carotid artery (CCA) in the upper neck at around the level of the fourth cervical vertebra. (Figures 2, 3). The ICA has four parts with seven defined segments; in general, segments assist with lesion localization and are provided in parenthesis. The cervical part (cervical segment, C1) is first and enters the skull at the carotid foramen (Figure 5). It is distinguished from its companion external carotid artery by a lack of extracranial branching. Once in the skull, the petrous part (petrous segment, C2) traverses the carotid canal within the petrous portion of the temporal bone (Figure 5). Moving out of the temporal bone, the ICA then crosses into the cavernous sinus, where it is known as the cavernous part (lacerum segment, C3, cavernous segment, C4, clinoid segment, C5). Navigating the bony turns in this area results in a characteristic curvature known as the “carotid siphon” (Figure 6). From here, the vessel passes through the dura, where it becomes the cerebral or supraclinoid part (ophthalmic segment, C6, communicating segment, C7) and gives off the ophthalmic, posterior communicating, and anterior choroidal arteries; these posterior communicating arteries (PCommA) run to the ipsilateral posterior cerebral arteries (PCA), thus connecting the anterior and posterior circulations and forming part of the circle of Willis (Figure 7). At the terminus, the internal carotid arteries bifurcate into the bilateral anterior cerebral arteries (ACA) and MCAs. Acute ICA lesions can cause dramatic symptoms due to restricted blood flow to the ipsilateral ACA and MCA and are large vessel occlusions.[9-12]

Figure 3. CTA of the neck showing the bilateral carotid bifurcations. Artifact from metal in the patient’s teeth.

Figure 3. CTA of the neck showing the bilateral carotid bifurcations. Artifact from metal in the patient’s teeth.

Figure 4. CTA of the neck showing patent bilateral ICAs as well the the bilateral VAs entering the foramen magnum

Figure 4. CTA of the neck showing patent bilateral ICAs as well the the bilateral VAs entering the foramen magnum

The ACAs run between the frontal hemispheres in the longitudinal fissure and supply a large portion of the medial cerebral structures such as the medial frontal and parietal lobes as well as the basal ganglia and parts of the internal capsule. They are smaller than the MCAs and their course is recurrent frontal-occipital and inferior-superior, which can make visualization in the axial plane difficult to appreciate. The paired arteries are connected by the anterior communicating artery (ACommA) early in their course which is the final connection completing the circle of Willis (Figure 7). Lesions within the A1 segment, which runs from the carotid terminus to the ACommA are considered large vessel occlusions though may be better tolerated due to collateral flow through the anterior communicating artery.[9,10,12] 

Figure 5. CTA of the head showing the ICAs as they enter the skull and traverse the petrous portion of the temporal bone.

Figure 5. CTA of the head showing the ICAs as they enter the skull and traverse the petrous portion of the temporal bone.

Figure 6. CTA of the head showing the ICA as it traverses the cavernous sinus; the carotid siphon is well visualized on the left.

Figure 6. CTA of the head showing the ICA as it traverses the cavernous sinus; the carotid siphon is well visualized on the left.

The MCAs provide circulation to the remaining frontal and parietal lobes, basal ganglia, and internal capsules, as well as portions of the temporal lobes. They are larger and therefore more easily visualized than the ACAs (Figure 7). A lesion of the M1 segment, which runs from the carotid terminus to the bifurcation into the M2 segments, is considered a large vessel occlusion (Figures 8, 9).[9,10,12] 

Figure 7. CTA of the head showing an intact circle of Willis

Figure 7. CTA of the head showing an intact circle of Willis

Figure 8. CTA of the head showing an acute right M1 occlusion in the axial plane

Figure 8. CTA of the head showing an acute right M1 occlusion in the axial plane

Figure 9. Coronal MIPS of the same vascular occlusion noted in Figure 8 with clear deficit on the right compared with the left.

Figure 9. Coronal MIPS of the same vascular occlusion noted in Figure 8 with clear deficit on the right compared with the left.

Posterior circulation

The posterior circulation starts with the VAs, which are subclavian branches that traverse the cervical spine via transverse foramina (Figures 2, 3). Prior to joining, each vertebral artery gives off an ipsilateral posterior inferior cerebellar arteries (PICA) as well as the contributing vessels that form the anterior and posterior spinal arteries. Upon entering the skull via the foramen magnum, the bilateral vertebral arteries join to form the basilar artery at about the level of the medullo-pontine junction (Figures 4, 5, 6). As the basilar artery moves superiorly it gives off the bilateral anterior inferior cerebellar arteries (AICA), multiple bilateral small perforating pontine arteries, the bilateral superior cerebellar arteries, and then finally terminates with a bifurcation into the bilateral posterior cerebral arteries (PCA). As noted prior, these PCAs connect with the ipsilateral posterior communicating arteries from the anterior circulation (Figure 7). Vertebral, basilar, and early posterior cerebral artery occlusions are considered large vessel occlusions but there is, as of now, limited data on mechanical thrombectomy in these territories.[9,10,12,13]

Application

Reading the scan itself is fairly straightforward based on the vascular anatomy. We recommend starting caudally (usually the aortic arch) in the axial plane and tracing all four cervical vessels cranially until they form the circle of Willis and from there extend out into the major branches. The coronal plane is particularly useful for evaluation of the anterior cervical vessels and the MCAs. Significant asymmetry or loss of contrast opacification in vascular beds anatomically consistent with the presenting symptoms should be considered strokes until proven otherwise. Make note of vascular abnormalities such as significant carotid stenosis, aneurysms, and malformations. 

Additional 2-D and 3-D post-processing images may also be provided. The most common is maximum intensity projection (MIP), which highlights high density structures over low density; this allows for improved visualization of the contrast enhanced vasculature at the expense of the surrounding brain tissue. However, MIP images can be falsely negative and should not be used alone for primary vascular evaluation.[14]

CT Perfusion

Though less common than CTA, CTP may also be acquired in the emergency setting to evaluate for territorial changes in cerebral blood flow suggestive of stroke. It is particularly valuable for identifying core infarct and salvageable ischemic penumbra and is becoming an important part of interventional decision making. It has a similar sensitivity and specificity for acute ischemic stroke as CTA, its use has been validated in multiple interventional stroke studies, and it has been shown to predict core infarct size accurately compared to the gold standard MRI.[7,8,15]

Basic concepts

While the specifics of CTP are complex and beyond the scope of this article, there are a few important concepts. CTP operates under the “central volume principle,” which is represented by the equation CBF = CBV/MTT and defines the relationship between cerebral blood volume (CBV; volume of flowing blood in a set volume of brain tissue), blood flow (CBF; per time unit rate of flowing blood in a set volume of brain tissue), and mean transit time (MTT;  average time for blood to transit a set volume of brain tissue). To illustrate this concept, imagine an acute arterial occlusion. The obstruction causes an immediate increase in MTT due to slowed arterial flow through the affected tissue. To maintain CBF a local compensatory vasodilation occurs, increasing CBV. However, this vasodilation may not be able to compensate for rising MTT, causing a progressively inadequate CBF that may result in infarction.[5,16]

Algorithms translate detected changes in MTT, CBV, and CBF into images that can be used in clinical decision-making. MTT is obtained by measuring the movement of contrast through the affected tissue; this also gives a value known as Tmax, which is the time to achieve peak contrast density. CBV and CBF are calculated relative values (rCBF, rCBV) and based off of the surrounding normal tissue. Composite metrics, such as mismatch ratio, the ratio of penumbra to the core infarct volumes, and mismatch volume, the penumbra volume minus the core infarct volume, are also generated.[11] Though there is no set rule, there is evidence that thrombolysis benefit is maximized and hemorrhage risk minimized with a mismatch ratio of 1.8 or greater, a mismatch volume of 15ml or greater, and a core infarct volume less than 70ml.[17]

Figure 10. Illustrative CTP report for the same acute right M1 occlusion from Figures 8 and 9 showing the core infarct (purple) and associated penumbra (green). Note the large mismatch volume and ratio, indicating a relatively small core infarct rel…

Figure 10. Illustrative CTP report for the same acute right M1 occlusion from Figures 8 and 9 showing the core infarct (purple) and associated penumbra (green). Note the large mismatch volume and ratio, indicating a relatively small core infarct relative to the threatened penumbra.

Application

These values are then made into “parametric maps” superimposed onto axial CT slices, allowing for visual identification (Figures 10, 11). Different software may present the values and parametric maps differently; note that our institution uses RAPID (iSchemaView, Menlo Park, CA) and our example figures were generated by this software. Using Figure 10 as an example, we see purple and green areas as well as different volumes and ratios. The purple area corresponds to the volume of tissue with a rCBF less than 30% of the unaffected, healthy tissue and is considered the core infarct area. The green area corresponds to the volume of tissue with a Tmax longer than six seconds and is considered the ischemic penumbra. Though these threshold values were used and validated by the SWIFT PRIME and EXTEND-IA trials, they are not definitive or universal.[15,18] Familiarization with an institution’s software and threshold values is vital to interpreting CTP properly.

Importantly, CTP can be abnormal in other situations such as with chronic infarcts, vasospasm from subarachnoid hemorrhage, microvascular ischemia, and cerebral changes associated with seizure and feeding vessel stenosis.[16] Always interpret CTP in the context of the other imaging findings and anatomic consistency. 

Figure 11. Illustrative CTP report for the same acute right M1 occlusion from Figured 8, 9, and 10 showing territorially increased MTT with subtle reduction in CBF and a small area of asymmetrically elevated CBV in the area corresponding to infarcti…

Figure 11. Illustrative CTP report for the same acute right M1 occlusion from Figured 8, 9, and 10 showing territorially increased MTT with subtle reduction in CBF and a small area of asymmetrically elevated CBV in the area corresponding to infarction in Figure 10. This figure visually highlights the relationships between rCBV, cCBF, MTT, and Tmax.

Take Away Points

CT is the primary source of neuroimaging in the emergency department evaluation of stroke patients. NCCT is poor at detecting early acute infarcts directly, however it is excellent for hemorrhage detection. Use of CTA can demonstrate causative vascular lesions and addition of CTP can further delineate ischemia and determine how amenable it might be to intervention. Not all lesions identified by CTA and CTP will be amenable to thrombolysis or thrombectomy, but these are usually the only time effective ways available to emergency physicians to identify those that might be. Educating emergency physicians about these imaging modalities can both improve patient care through more rapid diagnosis in suspected stroke cases as well as help to streamline communication and treatment planning with consulting neurologists and neurointerventionalists. 


Expert Commentary

This is a well-written synopsis of modern neuroimaging used today’s ED for workup and emergent treatment of acute stroke. The reader should keep in mind that the primary thrust of this blog segment is on acute ischemic stroke - while advanced CT imaging (i.e. CTA) also has a crucial role in hemorrhagic stroke, this is more thoroughly addressed elsewhere.

Practically speaking, today’s CT/CTP/CTA is to suspected stroke what an EKG is to chest pain in the ED. While confirmatory tests (MRI for stroke, troponin for MI) take more time, all actionable data depends on the initial CT/CTP/CTA in acute stroke. I would also categorize the purpose of acute stroke imaging in the ED into two categories, but with perhaps broader brush-strokes:

  1. Determine if stroke is ischemic or hemorrhagic (“blood or no blood on CT”), and

  2. Determine the next course of action:

    1. If ischemic, do temporal and anatomic criteria mandate IV tPA, endovascular thrombectomy, both, or neither, 

    2. If hemorrhagic, is there mass effect and/or an underlying vascular lesion (arterial or venous) that mandates urgent intervention beyond best medical care.

While NCCT is sufficient to determine whether to proceed with IV tPA in the 0-4.5 hour time-window (with an NNT of 10-20), CTP/CTA are key to determining whether the patient requires emergent endovascular thrombectomy in the 0-24 hour time-window (with an NNT of 2.6-4). As these two time-windows overlap, the most practical approach is increasingly to obtain multi-modality imaging up-front / as rapidly as possible in the ED. It is important to remember that as of 2015, both IV tPA and endovascular thrombectomy are considered standard-of-care, and any patient presenting with acute ischemic stroke must undergo full workup and consideration of both treatments based upon national society / consensus guidelines.

An added note on NCCT versus CTP: while NCCT is the oldest modality in the ED, it continues to have tremendous value in acute stroke imaging. Presence or absence of early stroke changes on NCCT (quantified by the ASPECT score) can at times trump CTP in the 0-6 hr time-window, and CTP within any time-window must be interpreted in context of NCCT findings. For example, CTP may show no abnormality (or even luxury perfusion) in an area of established stroke on NCCT in cases of spontaneous recanalization. On the other hand, CTP can be very helpful in detecting small areas of ischemia not well seen on CT/CTA (even when reading NCCT using optimized 35/35 or 40/40 “stroke windows”), and CTP has higher sensitivity for small/distal branch occlusions than either CT/CTA.

The approach to cerebrovascular arterial anatomy is nicely reviewed. A few additional comments:

  1. ICA: acute ICA occlusions are most dramatic when reaching the terminus (thereby blocking the MCA/ACA), but those not reaching the supraclinoid ICA may at times be well-tolerated due to collaterals across the Circle of Willis,

  2. VA: the course/anatomy of the VA is rather variable, with one VA (typically the right) being less dominant as we age; similarly, PICA can have a variable origin and territory of supply, and

  3. BA: while randomized trials of endovascular thrombectomy for basilar occlusion have not been published, the natural history of BA occlusion is typically devastating/fatal, and a large body of non-randomized data (case series/cohorts) shows marked improvement over this natural history following endovascular thrombectomy for BA stroke in selected patients.

jahromi.png
 

Vice Chair of Regional Neurosurgery

Professor of Neurological Surgery

Department of Neurological Surgery

Feinberg School of Medicine


How to Cite this Post

[Peer-Reviewed, Web Publication] Seltzer J, Neill L. (2020, Jan 6). Emergency Guide to Stroke Neuroimaging. [NUEM Blog. Expert Commentary by Jahromi B]. Retrieved from http://www.nuemblog.com/blog/2018/4/20/stroke-neuroimaging


References

  1. National Center for Chronic Disease Prevention and Health Promotion , Division for Heart Disease and Stroke Prevention. “Stroke Fact Sheet.” Last Update: September 1, 2017. Accessed from https://www.cdc.gov/dhdsp/data_statistics/fact_sheets/fs_stroke.htm

  2. Emberson J, Lees KR, Lyden P, et al., for the Stroke Thrombolysis Trialists’ Collaborative Group. Effect of treatment delay, age, and stroke severity on the effects of intravenous thrombolysis with alteplase for acute ischaemic stroke: a meta-analysis of individual patient data from randomised trials. Lancet. 2014 Nov 29;384(9958):1929-35.

  3. Filho JO, Samuels OB. Approach to reperfusion therapy for acute ischemic stroke. UpToDate. Last Update: September 14, 2018. Accessed from https://www.uptodate.com/contents/approach-to-reperfusion-therapy-for-acute-ischemic-stroke

  4. Chaela JA, Kidwell CS, Nentwich LM, et al.. Magnetic resonance imaging and computed tomography in emergency assessment of patients with suspected acute stroke: a prospective comparison. Lancet. 2007 Jan 27; 369(9558): 293–298.

  5. Nadgir R, Yousef DM. “Vascular Diseases of the Brain.” In Neuroradiology: The requisites. 4th Ed. (2017). Philadelphia, PA: Mosby/Elsevier

  6. Yoon W, Seo JJ, Kim JK, Cho KH, Park JG, Kang HK. Contrast enhancement and contrast extravasation on computed tomography after intra-arterial thrombolysis in patients with acute ischemic stroke. Stroke. 2004 Apr;35(4):876-81.

  7. Sabarudin A, Subramaniam C, Sun Z. Cerebral CT angiography and CT perfusion in acute stroke detection: a systematic review of diagnostic value. Quant Imaging Med Surg. 2014 Aug;4(4):282-90.

  8. Shen J, Li X, Li Y, Wu B. Comparative accuracy of CT perfusion in diagnosing acute ischemic stroke: A systematic review of 27 trials. PLoS One. 2017 May 17;12(5):e0176622. 

  9. Mancall EL. “Vascular Supply of the Brain and Spinal Cord” In Gray's clinical neuroanatomy: The anatomic basis for clinical neuroscience. 1st Ed. (2011). Philadelphia, PA: Elsevier/Saunders.

  10. Mtui E, Gruener G, Dockery P. “Blood Supply of the Brain.” In Fitzgerald’s Clinical Neuroanatomy and Neuroscience. 7th Ed. (2016). Edinburgh: Elsevier Saunders.

  11. Bouthillier A, van Loveren HR, Keller JT. Segments of the internal carotid artery: a new classification. Neurosurgery. 1996 Mar;38(3):425-32.

  12. The Joint Commission. Specifications Manual for Joint Commission National Quality Measures (v2018B). Last Updated: 2018. Accessed from https://manual.jointcommission.org/releases/TJC2018B/DataElem0771.html

  13. Filho JO, Samuels OB. Mechanical thrombectomy for acute ischemic stroke. UpToDate. Last Update: March 22 2019. Accessed from https://www.uptodate.com/contents/mechanical-thrombectomy-for-acute-ischemic-stroke

  14. Prokop M1, Shin HO, Schanz A, Schaefer-Prokop CM. Use of maximum intensity projections in CT angiography: a basic review. Radiographics. 1997 Mar-Apr;17(2):433-51. 

  15. Mokin M, Levy EI, Saver JL, Siddiqui AH, Goyal M, Bonafé A, Cognard C, Jahan R, Albers GW; SWIFT PRIME Investigators. Predictive Value of RAPID Assessed Perfusion Thresholds on Final Infarct Volume in SWIFT PRIME (Solitaire With the Intention for Thrombectomy as Primary Endovascular Treatment). Stroke. 2017 Apr;48(4):932-938.

  16. Lui YW, Tang ER, Allmendinger AM, Spektor V. Evaluation of CT perfusion in the setting of cerebral ischemia: patterns and pitfalls. AJNR Am J Neuroradiol. 2010 Oct;31(9):1552-63.

  17. Bivard A, Levi C, Krishnamurthy V, McElduff P, Miteff F, Spratt NJ, Bateman G, et al.. Perfusion computed tomography to assist decision making for stroke thrombolysis. Brain. 2015 Jul;138(Pt 7):1919-31. 

  18. Campbell BC, Mitchell PJ, Kleinig TJ, Dewey HM, Churilov L, Yassi N, Yan B,et al.; EXTEND-IA Investigators. Endovascular therapy for ischemic stroke with perfusion-imaging selection. N Engl J Med. 2015 Mar 12;372(11):1009-18.


Posted on January 6, 2020 and filed under Neurology.

Rise and Shine: A Review of the WAKE-UP Trial

Written by: Gabrielle Bunney, MD (NUEM PGY-2) Edited by: Alex Ireland, (NUEM PGY-4) Expert commentary by: Chris Richards, MD, MS


Introduction

Wake up strokes have always been a clinical conundrum. Current practice guidelines from the American Stroke Association on the treatment of acute ischemic strokes specify a maximum of 4.5 hours from time of symptom onset to the delivery of alteplase therapy. [1] However, patients often awaken with these symptoms or are unable to give a clear history of symptom onset and thus are not eligible for alteplase therapy. Initial non-contrast computed tomography can identify whether or not an acute hemorrhage is present, but confirmatory imaging for ischemic stroke involves magnetic resonance imaging (MRI). Studies are now looking at the utility of early MRI in the diagnostic and therapeutic pathways of acute ischemic stroke. These studies are specifically looking at a positive signal on diffusion-weighted imaging (DWI) and a negative signal on FLAIR imaging to identify recent cerebral infarction. Multiple studies have found that there is adequate sensitivity and specificity of DWI-FLAIR mismatch to suggest stroke onset within 4.5 hours. [2-4] Armed with these new data, this paper’s goal was to determine whether patients with an unknown time of symptom onset, but with a mismatch on DWI and FLAIR MRI imaging, would benefit from thrombolysis with intravenous alteplase. 

Study

Thomalla G, Simonsen CZ, et. al “MRI-Guided Thrombolysis for Stroke with Unknown Time of Onset | NEJM.” New England Journal of Medicine, Oxford University Press, www.nejm.org/doi/full/10.1056/NEJMoa1804355. [5]

Study Design

This study was a multi-center, randomized, double blind, and placebo controlled clinical trial. It involved 70 experienced stroke research centers in eight European countries. There was a central image-reading committee that reviewed all images for patient enrollment to evaluate inclusion and exclusion, and to arbitrate disagreements. 

Population

Patients between the ages of 18 and 80 were eligible for the study if they clinically had an acute stroke and were able to perform their activities of daily living prior to this event. The patient had to awaken with these symptoms, be unsure about the time of onset secondary to confusion or aphasia, or have a timeline of symptoms greater than 4.5 hours, without an upper limit. 1,362 patients underwent screening. 859 were excluded, leaving 503 that were randomized. 254 of those were given alteplase and 249 received placebo. 

image3.png

Intervention Protocol

Selected patients underwent DWI and FLAIR MRI imaging. Those who had a mismatch, defined as an abnormal signal on DWI, but no signal on FLAIR, were then randomized. Excluded were those with intracranial hemorrhage, lesions larger than one third of the middle cerebral artery territory, those who were to undergo thrombectomy, those with severe stroke, defined as greater than 25 on the National Institute of Health Stroke Scale (NIHSS), and those that had any other contraindication to alteplase aside from time from last known normal. Those that were randomized into the alteplase group were given 0.9mg/kg of alteplase with 10% administered as a bolus and the rest given as an infusion over 60 minutes. Assessments were then conducted between 22 and 36 hours after randomization, between 5 and 9 days, and finally at 90 days. 

Outcome Measures

This study had two end point measurements: efficacy and safety. The primary efficacy outcome measurement was favorable clinical outcome defined as a score of 0 to 1 on the modified Rankin scale 90 days after randomization. Secondary efficacy outcome measurements ranged from depression scores to activities of daily living measurements. 

The primary safety outcome was death and a composite outcome of death or dependence (4-6 on the modified Rankin scale) at 90 days. Secondary safety endpoints were symptomatic intracranial hemorrhage and the incidence of parenchymal hematoma type 2 on MRI 22 to 36 hours after randomization. 

Results

The demographics between the alteplase and placebo groups were similar for age, sex, and medical history. However, in the alteplase group there was a higher rate of intracranial occlusion of the internal carotid artery. The average time for treatment of the alteplase and placebo groups was 3.1 and 3.2 hours after symptom recognition, respectively. 

Alteplase was found to be associated with favorable outcome at 90 days, with 53.3% in the alteplase group and only 41.8% in the placebo group having a modified Rankin score between 0 and 1 at 90 days, p=0.02. The secondary efficacy endpoints lacked power due to the fact that the study was terminated early because of a loss of funding. Table 2 from the original article describes the efficacy findings.

image3.png

The safety groups were sized 251 in the alteplase group due to 5 patients not receiving alteplase and 244 in the placebo group due to 4 patients not receiving placebo. Death or dependency was found in 13.5% of the alteplase group and 18.3% of the placebo group, p=0.17. However, death at 90 days was higher in the alteplase group at 4.1%, while in the placebo group it was 1.2%, p=0.07. There were numerically more parenchymal hemorrhages in the alteplase group than in the placebo group, with 10 in the alteplase group and 1 in the placebo group. Table 3 from the original article describes the safety outcomes.

image3.png

Interpretation

The primary efficacy outcome of this study, favorable functional outcome at 90 days, was higher in the group that received alteplase than in the group that received placebo and was statistically significant. Additionally, the primary safety outcome of death or disability was higher in the placebo group than in the alteplase group, though this was not found to be statistically significant. Death at 90 days was found to be numerically higher in the alteplase group than the placebo group, although not statistically significant. In extrapolating the data from the paper, the number needed to treat is 9.4 and the number needed to harm is 36.3. The ratio of these numbers suggests that treatment provides a greater benefit than risk. 

There are several limitations to this study. The trial was stopped early due to lack of funding, and so we may be overestimating the benefit or underestimating the risk. The authors estimated that they needed approximately 800 patients to have sufficient power, yet enrolled only 503. Bleeding complications and death at 90 days were numerically higher in the alteplase group, though this was not statistically significant. Trials such as ATLANTIS A and B, and ASK, were all stopped early due to harm because of increased bleeding in the alteplase groups. [6-8] It is unknown whether the addition of 297 patients to meet the pre-specified enrollment target of 800 in the WAKE-UP trial would have resulted in statistical significance. 

The population of this study had a median NIHSS of 6 out of 42, a relatively low stroke severity. The DAWN, DEFUSE, NINDS, and SITS-MOST trials, all significant studies in the progression of stroke research, had NIHSS medians of 17, 16, 14, and 12, respectively. [9-12] It is unclear if MRI-guided alteplase therapy would benefit patients with more severe strokes. Additionally, this paper excluded patients who were selected for thrombectomy. Patients selected for thrombectomy have large clot burdens in the internal carotid artery or middle cerebral artery that often have a modified Rankin score greater than 6. [13] By not including these patients, the WAKE-UP trial does not show the benefit of medical treatment in these sicker patients with a larger clot burden. 

Lastly, the study was only performed in experienced research stroke centers with readily available diagnostic pathways and MRI. Of the 1,362 patients imaged and screened, only 37% met intervention criteria. Many did not have DWI-FLAIR mismatch, and some did not have any DWI lesion, suggesting a transient ischemic attack or a stroke mimic. A smaller hospital is unlikely to have the experience or equipment to be able to screen these more difficult patients for the few that can actually proceed to intervention. 

Future Areas of Research

A replication of this study with additional subjects and sufficient power to confirm the beneficial effect of alteplase in MRI-guided thrombolysis would be the next step. Inclusion of alteplase plus thrombectomy in appropriate patients presenting after 4.5 hours with mismatch on DWI-FLAIR is another possible study. For example, TWIST (ClinicalTrials.gov Identifier: NCT03181360) and TIMELESS (ClinicalTrials.gov Identifier: NCT03785678) are two large clinical trials that will hopefully give more information about expanding the time window for thrombolysis. [14,15]

Review

  • MRI DWI-FLAIR mismatch may be able to allow more patients to receive alteplase therapy after an acute ischemic stroke

  • Alteplase still shows benefit for treating stroke even with an unknown timeline when used in conjunction with MRI DWI-FLAIR mismatch

  • Similar to prior studies, alteplase is associated with numerically higher instances of intracranial hemorrhage 

  • Further research needs to be done to increase the power of this study


Expert Commentary

Really nice summary of the recent WAKE-UP* trial, and you bring up important considerations about both the pros and the cons of this study. WAKE-UP addressed an important clinical question: is it safe and effective for patients who have no other disqualifying reasons aside from their last known normal time to receive thrombolysis, if imaging shows a small area of infarction but a large area of ischemia? As you mention, intervention patients in the study: a) received intravenous tissue plasminogen activator (IV tPA) when otherwise they would not have, b) had increased odds of having a favorable outcome compared to standard of care, c) though with numerically greater instances of hemorrhage. 

WAKE-UP fits into a narrative with two other important recent trials, DAWN* and DEFUSE-3*that studied the outcomes of patients with last known normal (LKN) times greater than conventional LKN time cut-offs (4.5 hours for IV tPA and 6 hours for endovascular therapy) and have found efficacy of reperfusion in these extended windows for select patients. A third trial, EXTEND,* has been presented in abstract form and has demonstrated clinical improvement in select AIS patients receiving IV tPA up to 9 hours from LKN time (https://abstractsonline.com/pp8/#!/4715/presentation/13367). Importantly, these trials that expand the time window for reperfusion used imaging-based criteria for inclusion: WAKE-UP used MR, DAWN used a non-contrast CT scan compared to severity of clinical syndrome, DEFUSE-3 used CT perfusion along with a computer software program to identify the infarcted “core” and the ischemic penumbra, and EXTEND required a penumbral mismatch on CT perfusion or MRI.

From a pathophysiological perspective, this makes sense. If imaging can identify a large area of ischemia and small area of infarction, reperfusion should potentially result in the salvage of at least some of those reversibly damaged cells. It should also result in less pronounced hemorrhagic side effects because the area of known infarction is less – remember, not only neurons die in infarcted brain, so do blood vessel endothelium cells, a contributing factor in post-reperfusion hemorrhage. [16]

Looking into the future of acute stroke care, these clinical trials give promise for individualized acute stroke treatment. Rather than being beholden to a rigid time cut-off (that evidence is showing is not one-size-fits-all), we can look to imaging to inform acute treatment decision. We have learned from subgroup analysis from DEFUSE-3 that some patients slowly progress in their stroke pathophysiology, meaning that even beyond 24 hours, some patients have a favorable core to penumbra ratio. [17] Other patients quickly progress in their stroke pathophysiology and may match their ischemic core to their salvageable penumbra well before traditional time-cut offs. [18]

It is possible that image-based selection criteria could be integral to the screening of all candidates for acute reperfusion therapy in the future. As WAKE-UP, EXTEND, DAWN, and DEFUSE-3 have shown us, there are some patients that can be reasonably considered for treatment beyond traditional time cut-offs. The same imaging criteria that extended the window for patients in these studies may be the same criteria that, in the future, could identify patients within the traditional time window who are likely to not benefit from treatment and who may have an increased risk of hemorrhagic conversion. One can image a patient without evidence of a salvageable penumbra presenting at 3 hours, for example, for whom the risks of IV tPA may, in fact, outweigh the potential benefits. 

Lastly, I would hazard readers from interpreting the results of WAKE-UP, EXTEND, DAWN, and DEFUSE-3 as providing comfort in delaying thrombolysis or endovascular therapy for patients in extended time windows who would otherwise have indications for reperfusion. For IV tPA, longer delay is associated with increased risk of symptomatic intracranial hemorrhage and more timely treatment is associated with better outcomes. In the 2015 endovascular therapy trials, [19-23] even for patients within 6 hours of LKN, more timely treatment was associated with better outcomes. Even if the imaging protocols used in WAKE-UP, EXTEND, DAWN, and DEFUSE-3 can identify “slow progressors” that can be treated outside current treatment windows, these patients’ stroke are still progressing as time goes by. [18] Systems that promote timely evaluation of patients with stroke systems should be expected to help patients in extended time window, as they do patients within traditional time windows. {24,25]

Studies like WAKE-UP that test traditional inclusion and exclusion criteria for reperfusion give promise for safer and more effective stroke treatment. We look forward to future clinical trials, like TIMELESS* and TWIST*, that hopefully will give further clarity on this clinical question.

WAKE-UP [5]: Efficacy and Safety of MRI-based Thrombolysis in Wake-up Stroke Trial

DAWN [10]: Diffusion Weighted Imaging (DWI) or Computerized Tomography Perfusion (CTP) Assessment With Clinical Mismatch in the Triage of Wake Up and Late Presenting Strokes Undergoing Neurointervention Trial

DEFUSE-3 [9]: Endovascular Therapy Following Imaging Evaluation for Ischemic Stroke 3 Trial

EXTEND [26]: EXtending the time for Thrombolysis in Emergency Neurological Deficits Trial

TIMELESS: Tenecteplase in Stroke Patients Between 4 and 24 Hours Trial (https://clinicaltrials.gov/ct2/show/NCT03785678)

TWIST: Tenecteplase in Wake-up Ischaemic Stroke Trial (https://clinicaltrials.gov/ct2/show/NCT03181360)

Chris_Richards-37.png
 

Chris Richards, MD, MS

Assistant Professor

Department of Emergency Medicine

Northwestern University


How to Cite this Post

[Peer-Reviewed, Web Publication] Bunney G, Ireland A. (2019, Sept 9). Rise and Shine: A Review of the WAKE-UP Trial. [NUEM Blog. Expert Commentary by Richards C]. Retrieved from http://www.nuemblog.com/blog/wake-up-trial.


Other Posts You May Enjoy


Citations

  1. Powers WJ, Rabinstein AA, Ackerson T, et al. 2018 Guidelines for the Early Management of Patients With Acute Ischemic Stroke: A Guideline for Healthcare Professionals From the American Heart Association/American Stroke Association. Stroke 2018;49:e46-e110.

  2. Aoki, Junya, et al. “FLAIR Can Estimate the Onset Time in Acute Ischemic Stroke Patients.” Journal of the Neurological Sciences, vol. 293, no. 1-2, 2010, pp. 39–44., doi:10.1016/j.jns.2010.03.011

  3. Petkova, Mina, et al. “MR Imaging Helps Predict Time from Symptom Onset in Patients with Acute Stroke: Implications for Patients with Unknown Onset Time.” Radiology, vol. 257, no. 3, 2010, pp. 782–792., doi:10.1148/radiol.10100461.

  4. Thomalla, Götz, et al. “DWI-FLAIR Mismatch for the Identification of Patients with Acute Ischaemic Stroke within 4·5 h of Symptom Onset (PRE-FLAIR): a Multicentre Observational Study.” The Lancet Neurology, vol. 10, no. 11, 2011, pp. 978–986., doi:10.1016/s1474-4422(11)70192-2.

  5. Thomalla G, Simonsen CZ, et. al “MRI-Guided Thrombolysis for Stroke with Unknown Time of Onset | NEJM.” New England Journal of Medicine, Oxford University Press, www.nejm.org/doi/full/10.1056/NEJMoa1804355.

  6. Albers, Gregory W., et al. “ATLANTIS Trial.” Stroke, vol. 33, no. 2, 2002, pp. 493–496., doi:10.1161/hs0202.102599.

  7. Clark, Wayne M., et al. “Recombinant Tissue-Type Plasminogen Activator (Alteplase) for Ischemic Stroke 3 to 5 Hours After Symptom Onset.” Jama, vol. 282, no. 21, Jan. 1999, p. 2019., doi:10.1001/jama.282.21.2019.

  8. Donnan, G. A. “Streptokinase for Acute Ischemic Stroke with Relationship to Time of Administration: Australian Streptokinase (ASK) Trial Study Group.” JAMA: The Journal of the American Medical Association, vol. 276, no. 12, 1996, pp. 961–966., doi:10.1001/jama.276.12.961.

  9. Albers, Gregory W, et al. “Thrombectomy for Stroke with Selection by Perfusion Imaging.” New England Journal of Medicine, vol. 378, no. 19, 2018, pp. 1849–1850., doi:10.1056/nejmc1803856.

  10.  Nogueira, Raul G, et al. “Thrombectomy 6 to 24 Hours after Stroke.” New England Journal of Medicine, vol. 378, no. 12, 2018, pp. 1161–1162., doi:10.1056/nejmc1801530.

  11.  “Tissue Plasminogen Activator for Acute Ischemic Stroke.” New England Journal of Medicine, vol. 333, no. 24, 1995, pp. 1581–1588., doi:10.1056/nejm199512143332401.

  12. Wahlgren, Nils, et al. “Thrombolysis with Alteplase for Acute Ischaemic Stroke in the Safe Implementation of Thrombolysis in Stroke-Monitoring Study (SITS-MOST): an Observational Study.” The Lancet, vol. 369, no. 9558, 2007, pp. 275–282., doi:10.1016/s0140-6736(07)60149-4.

  13. Campbell, Bruce C V, et al. “Endovascular Thrombectomy for Stroke: Current Best Practice and Future Goals.” Bmj, vol. 1, no. 1, 2016, pp. 16–22., doi:10.1136/svn-2015-000004.

  14. “Tenecteplase in Wake-up Ischaemic Stroke Trial (TWIST).” ClinicalTrials.gov, clinicaltrials.gov/ct2/show/NCT03181360.

  15. “Tenecteplase in Stroke Patients Between 4 and 24 Hours (TIMELESS).” ClinicalTrials.gov, https://clinicaltrials.gov/ct2/show/NCT03785678

  16. Yaghi S, Eisenberger A, Willey JZ. Symptomatic intracerebral hemorrhage in acute ischemic stroke after thrombolysis with intravenous recombinant tissue plasminogen activator: a review of natural history and treatment. JAMA neurology 2014;71:1181-5. PMCID: 4592535.

  17. Christensen S, Mlynash M, Kemp S, et al. Persistent Target Mismatch Profile >24 Hours After Stroke Onset in DEFUSE 3. Stroke 2019;50:754-7. PMCID.

  18. Rocha M, Jovin TG. Fast Versus Slow Progressors of Infarct Growth in Large Vessel Occlusion Stroke: Clinical and Research Implications. Stroke 2017;48:2621-7. PMCID.

  19. Berkhemer OA, Fransen PS, Beumer D, et al. A randomized trial of intraarterial treatment for acute ischemic stroke. N Engl J Med 2015;372:11-20. PMCID.

  20. Campbell BC, Mitchell PJ, Kleinig TJ, et al. Endovascular therapy for ischemic stroke with perfusion-imaging selection. N Engl J Med 2015;372:1009-18. PMCID.

  21. Fransen PS, Berkhemer OA, Lingsma HF, et al. Time to Reperfusion and Treatment Effect for Acute Ischemic Stroke: A Randomized Clinical Trial. JAMA neurology 2015:1-7. PMCID.

  22. Goyal M, Demchuk AM, Menon BK, et al. Randomized assessment of rapid endovascular treatment of ischemic stroke. N Engl J Med 2015;372:1019-30. PMCID.

  23. Jovin TG, Chamorro A, Cobo E, et al. Thrombectomy within 8 hours after symptom onset in ischemic stroke. N Engl J Med 2015;372:2296-306. PMCID.

  24. Prabhakaran S, Ruff I, Bernstein RA. Acute stroke intervention: a systematic review. JAMA 2015;313:1451-62. PMCID.

  25. Higashida R, Alberts MJ, Alexander DN, et al. Interactions within stroke systems of care: a policy statement from the American Heart Association/American Stroke Association. Stroke 2013;44:2961-84. PMCID.

  26. Churilov L, Ma H, Campbell BC, Davis SM, Donnan GA. Statistical Analysis Plan for EXtending the time for Thrombolysis in Emergency Neurological Deficits (EXTEND) trial. International journal of stroke : official journal of the International Stroke Society 2018:1747493018816101. PMCID.

Posted on September 9, 2019 and filed under Neurology.